The following test report of an early version of the 5 MHz ultra-low oscillator was prepared by NIST in 1990. Newer versions of this oscillator are now available.
U.S. DEPARTMENT OF COMMERCE NATIONAL INSTITUTE OF STANDARDS AND TECHNOLOGY NATIONAL ENGINEERING LABORATORY Boulder, Colorado 80303
REPORT OF CALIBRATION
CALIBRATION OF 5 MHZ CRYSTAL OSCILLATOR MODEL 500-01812A Serial # 8339045 FOR WENZEL ASSOCIATES
25 NOVEMBER 1990
The oscillators were plugged in and allowed to warm up overnight. The phase noise of these units was measured using the measurement system schematically shown in Fig. 1. The general approach is outlined in the enclosed publications [1-3]. A low-noise frequency doubler was used to improve the noise floor by several dB over our normal arrangement. The phase sensitivity of the mixer was determined using the beat frequency method with an accuracy of + 0.2 dB [1, 2]. A noise reference was used to verify the noise density calibration of the FFT to within 0.2 dB [2]. The results of these measurements are shown in Table 1.
The phase noise of these oscillators is extremely low, which makes it difficult to eliminate the biases in the measurements due to the noise floor of the measurement system and the contribution of the reference oscillator. A “three-corner hat” involving the different oscillators was used to determine the phase noise of each oscillator under test. All the oscillators had the same output power to within ± 0.5 dB which leads to very similar values for the mixer sensitivity and measurement noise floor for each of the measurements. The noise floor of the measurement system was determined by driving both frequency doublers with the same oscillator at approximately the average power level used in the phase noise measurements, This required the use of an external low noise amplifier to compensate for the losses in the power splitter. The cables from the doublers to the phase noise measurement system and the phase shift within the phase noise detector were kept the same for all the measurements. The noise floor of the system was then subtracted from the measurements between each of the oscillator pairs.
The resulting data were then analyzed to determine the phase noise of each oscillator. The phase noise measurements were made over a wide range of Fourier frequencies to be able to fit the phase noise to a model, and to check that the phase noise varied in a reasonable way with Fourier frequency. The results are summarized in Table 1.
The following model agrees with all the phase noise measurements for oscillator 8339045 to within 1.5 dB for Fourier frequencies from 1 to 100,000 Hz.
£(f) (8339045) = 10^-l2.86 / f 3 + 10^-15.0 / f + 10^-178.7 .
The measurements were made at the minimum value near the specified Fourier frequency to avoid biases due to spurious signals such as harmonics of the power lines. No attempt was made to measure the spurious signals or to identify which ones came from the measurement system or the oscillators. A minimum of 400 samples was taken at Fourier frequencies from 1 to 10 Hz and 800 samples from 20 Hz to 100 kHz using a FFT spectrum analyzer with a Hanning window. This leads to a fractional statistical uncertainty of the spectral densities of ± 0.05 (0.21 dB) in the region from 1 to 10 Hz and ± 0.035 (0.15dB) in the region from 20 Hz to 100 kHz [3]. The data for oscillator 8339045 has a combined error of ±1.5 dB between 1 Hz and 1 kHz. The data for oscillators in the 10 to 100 kHz region is less certain due to the nearness of the noise floor of the system. The error in this region is + 1.5 -3 dB.
For the Director
National Measurement Laboratory
Fred L. Walls Time and Frequency Division Test No. 77130C
TABLE 1 PHASE NOISE RESULTS
| Fourier Frequency |
833 vs 671 Raw (f) |
833 vs 829 Raw (f) |
671 vs 829 Raw (f) |
Noise Floor Pair (f) |
833 (f) |
MODEL (f) |
DIFF |
| Hz | dBC/Hz | dBC/Hz | dBC/Hz | dBC/Hz | dBC/Hz | dBC/Hz | dB |
| FREQ Hz | AB | AC | BC | NOISE FLOOR |
1/2(AB+AC) -BC-NF) |
MODEL A |
DIFF A |
| 100000 | -173.4 | -171.6 | -172.0 | -176.0 | -178.7 | -178.7 | -0.1 |
| 50000 | -173.4 | -171.6 | -172.0 | -176.6 | -178.3 | -178.6 | 0.4 |
| 20000 | -173.5 | -171.6 | -172.0 | -176.6 | -178 4 | -178.5 | 0.1 |
| 10000 | -173.5 | -171.6 | -172.0 | -176.2 | -178.7 | -178.4 | -0.3 |
| 5000 | -173.2 | -171.6 | -171.6 | -176.0 | -179 4 | -178.1 | -1.3 |
| 2000 | -172.6 | -171.3 | -171.2 | -176.0 | -178.5 | -177.3 | -1.2 |
| 1000 | -171.2 | -170.4 | -170.5 | -174.8 | -176.5 | -176.3 | -0.2 |
| 500 | -168.8 | -169.8 | -168.9 | -173.5 | -175.0 | -174.7 | -0.3 |
| 200 | -166.2 | -167.3 | -166.3 | -171.4 | -172.2 | -172.0 | -0.3 |
| 100 | -163.8 | -165.4 | -164.3 | -169.1 | -169.8 | -169.4 | -0.4 |
| 50 | -161.0 | -162.3 | -161.0 | -166.8 | -167.2 | -166 5 | -0.7 |
| 20 | -155.9 | -154.3 | -154.2 | -162.5 | -160.2 | -161.6 | 1.5 |
| 10 | -150.5 | -152.0 | -150.0 | -160.0 | -156.8 | -156.2 | -0.5 |
| 3.2 | -137.0 | -137.7 | -135.5 | -155.0 | -143.7 | -143.4 | -0.3 |
| 1 | -122.0 | -122.3 | -120.0 | -150.0 | -129.6 | -128.6 | -1.0 |
REFERENCES
“EXTENDING THE RANGE AND ACCURACY OF PHASE NOISE MEASUREMENTS” by F.L.Walls, A.J.D. Clements, C.M. Felton, M.A. Lombardi and M.D. Vanek, Proc. of 42nd Annual Symposium on Frequency Control, Baltimore, MD, June 1-4, 1988, pp. 432-441.
“ACCURACY MODEL FOR PHASE NOISE MEASUREMENTS” by F. L. Walls, C.M. Felton, A. J. D. Clements; and T. D. Martin, Proc. of 21st Annual Precise Time and Time Interval Planning Meeting, Redondo Beach, CA, Nov. 30 – Dec. 1, 1990, pp. 295-310.
“BIASES AND VARIANCES OF SEVERAL FFT SPECTRAL ESTIMATORS AS A FUNCTION OF NOISE TYPE AND NUMBER OF SAMPLES,” by F.L. Walls, D.B. Percival, and W.R. Irelan, Proc. of 43rd Annual Symposium on Frequency control, Denver, CO, May 31 – June 2, 1989, p. 336.
The following test report of an early version of the 100 MHz ultra-low oscillator was prepared by NIST in 1992. Newer versions of this oscillator are now available.
CALIBRATION OF 100 MHz CRYSTAL OSCILLATORS MODEL 500-02268B SERIAL #S 0578-9041 AND 2110-9220 FOR WENZEL ASSOCIATES
25 SEPTEMBER 1992
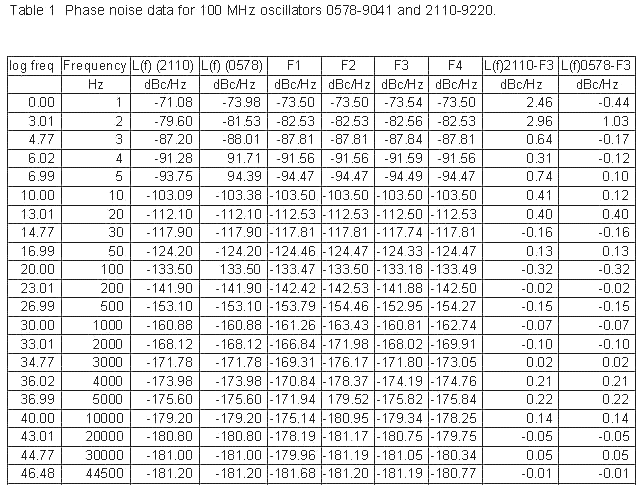
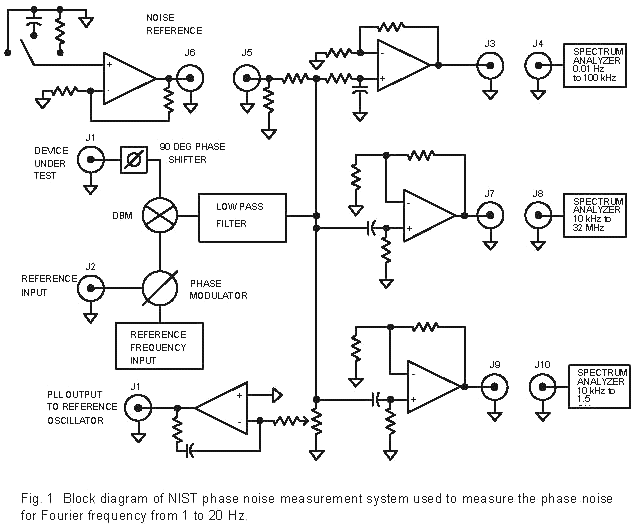
The phase noise of these units was measured using the measurement systems schematically shown in Figs. 1 and 2. The general approach is outlined in the references [1-4]. Measurements from 1 to 20 Hz were made against a multiplied 5 MHz reference using the measurement system schematically shown in Fig. 1. At higher Fourier frequencies the measurements were made using the cross correlation measurement system schematically shown in Fig. 2[3,4]. This system has a much lower noise floor than the single channel measurement system of Fig 1. In both cases the phase sensitivity of the mixer(s) was determined using the beat frequency method with an accuracy of + 0.2 dB [1,2]. A noise reference was used to verify the noise density calibration of the FFT to within 0.2 dB [2]. The results of these measurements are shown in Table 1.
The phase noise of these oscillators is extremely low. A “three-corner hat” involving the measurements between three different oscillators was used to determine the phase noise of each oscillator under test for Fourier frequencies from 20 Hz to 44.5 kHz. To within the resolution of our measurements the phase noise of oscillators 0578-9041 and 2110-9220 were identical. The lowest phase noise was obtained for the pair measurement between 0578-9041 and 2110-9220. The phase noise of the multiplied reference oscillator was significantly less than the measure the performance of each oscillator.
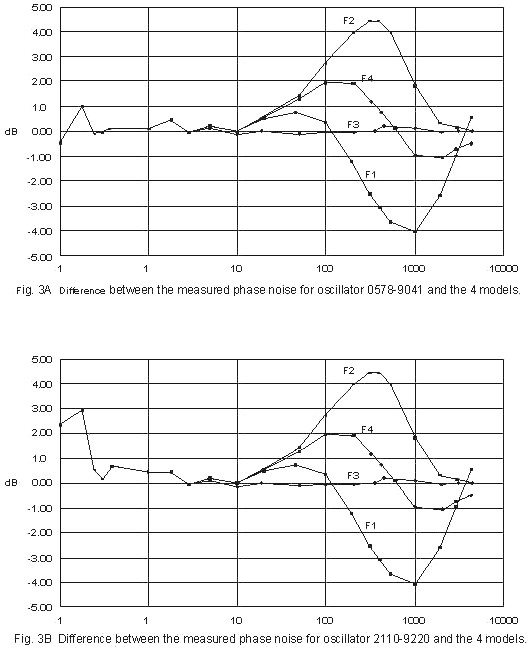
The phase noise measurements were made over a wide range of Fourier frequencies to be able to fit the phase noise to a model, and to check that the phase noise varied in a reasonable way with Fourier frequency. The results are summarized in Table 1. The difference between the measured data and four different models is shown in Fig. 3 for each oscillator. The models are
F l £(f) = 10^-7.35 / f 3 + l0^-l3.52 / f
F 2 £(f) = 10^-7.35 / f 3 + l0^-l8.l2
F 3 £(f) = 10^-7.35 / f 3 + l0^-l0.42 / f2 + l0^-l8.l3
F 4 £(f) = 10^-7.35 / f 3 + l0^-l4.l / f + l0^-l8.l8
Model F3 agrees with the phase noise measurements of both oscillators to within + 0.7 dB for Fourier frequencies from 3 to 44.5 kHz, whereas the other three models differ by 2 dB or more in the region from 100 Hz to 30 kHz. The good agreement of the F3 model to the data allows us to both confirm functional dependence of the phase noise and to specify that the noise floor is
£(f) = -181.3 ± 1 dBc/Hz for each oscillator.
The phase noise measurements were made at the minimum value near the specified Fourier frequency to avoid biases due to spurious signals such as harmonics of the power lines. No attempt was made to measure the spurious signals or to identify which ones came from the measurement system or the oscillators. A minimum of 400 samples was taken at Fourier frequencies from 1 to 20 Hz and 4000 samples from 20 Hz to 50 kHz using a FFT spectrum analyzer with a Hanning window. This leads to a fractional statistical uncertainty of the spectral densities of ± 0.05 (0.21 dB) in the region from 1 to 20 Hz and typically ± 0.12 (0.5 dB) in the region from 20 Hz to 50 kHz [4]. The data for oscillators 0578-9041 and 2110-9220 have a combined error of ±1 dB between 1 Hz and 50 kHz.
For the Director National Measurement Laboratory
Fred L. Walls Time and Frequency Division Test No. 77140s